Fulcrum
Product Design
Product Design
Product Design
Web
Web
Web
Transforming a complex insurance workflow into an intuitive, AI-powered experience.
Services
UI Design
Services
UI Design
Services
UI Design
Stack
Figma
Stack
Figma
Stack
Figma


Problem statement
How can I design an AI-powered experience that feels like working alongside a smart co-pilot — upload your files, watch progress unfold, chat to refine insights, and export polished client-ready reports.
Why?
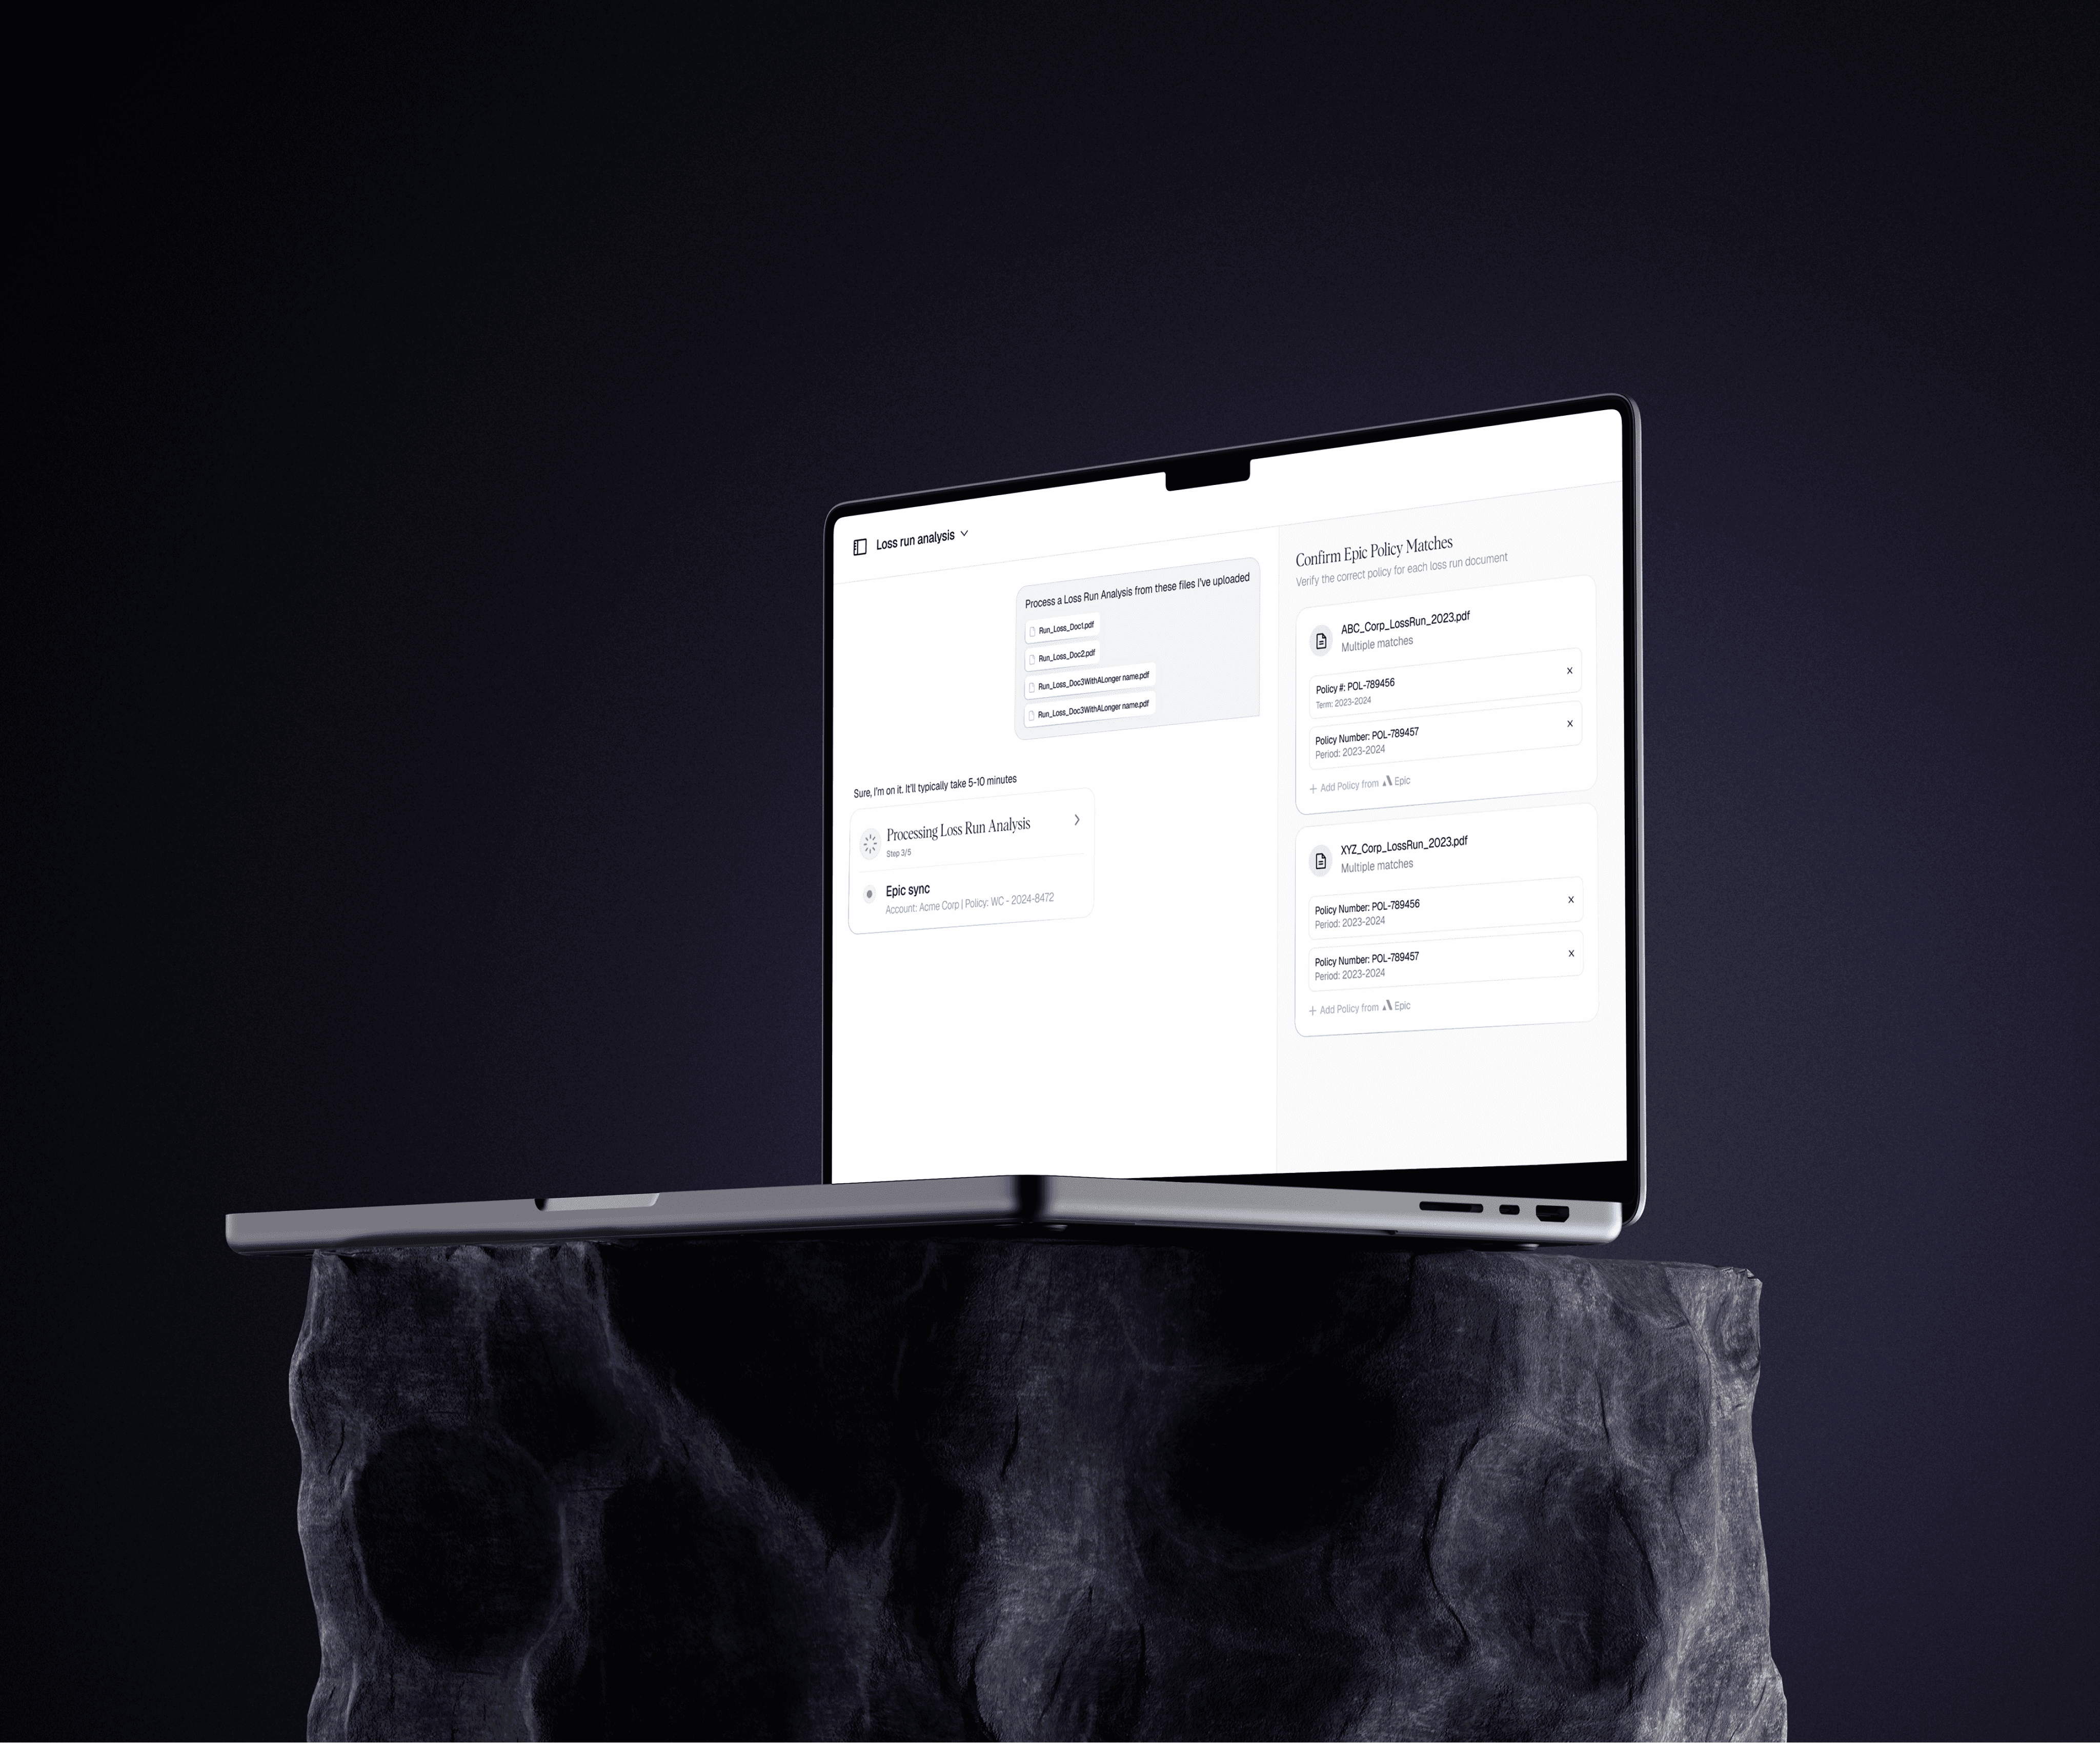
Loss Runs Analysis is one of the most time-consuming processes for account managers and producers at insurance brokerages. Traditionally, running an analysis is a data-heavy task of hours spent parsing dense PDFs, matching policies in Epic (the record system), and calculations to produce insights for clients.
Solution
Upload & Processing
Users drag and drop their files and watch real-time progress:
Uploaded → Parsing → Epic Sync → Crunching → Ready.
Each stage reassures users that the data is accurate and connected to the right policy.
Interactive Workspace
The UI splits into two panels for collaboration:
Left: Chat Panel
Conversational controls to filter, summarize, or visualize insights.
Right: Artifact Panel
Dynamic charts showing:
Loss ratios over time
Premiums vs. losses
Top accounts by claims
Key metrics & outliers
Every number is clickable and traceable back to its source data.
Export & Share
When finished, users can download their work in Excel, PowerPoint, or PDF — or save sessions to revisit later.
Key Features
Batch Upload of PDFs and Excel files
Progress Tracker with clear parsing and syncing states
Interactive Artifact that updates dynamically via chat
Traceable Metrics connected to Epic and source files
One-Click Exports for Excel, PowerPoint, and PDF
Research
Below are insights gathered from user interviews with account managers and producers across mid-size brokerages on how they currently manage Loss Runs.
Key insights:
Manual pain: Hours spent copying data from PDFs into Excel.
Disconnection: Policy numbers often mismatched with Epic.
Overload: Difficult to extract insights quickly for client meetings.
Need for trust: Users wanted transparency in where numbers came from.
These findings informed a design system centered on clarity, control, and traceability — ensuring every number can be traced back to its source.
Impact
The redesigned workflow reduced the average Loss Runs analysis time from hours to minutes and eliminated manual reconciliation.


